I wanted to find a time-saving feature in Postman that most people miss, so I decided to ask Agent Mode directly. I typed in a prompt looking for hidden shortcuts or underrated tabs that could make life easier. Agent Mode pointed me toward something really useful that I hadn’t noticed before.
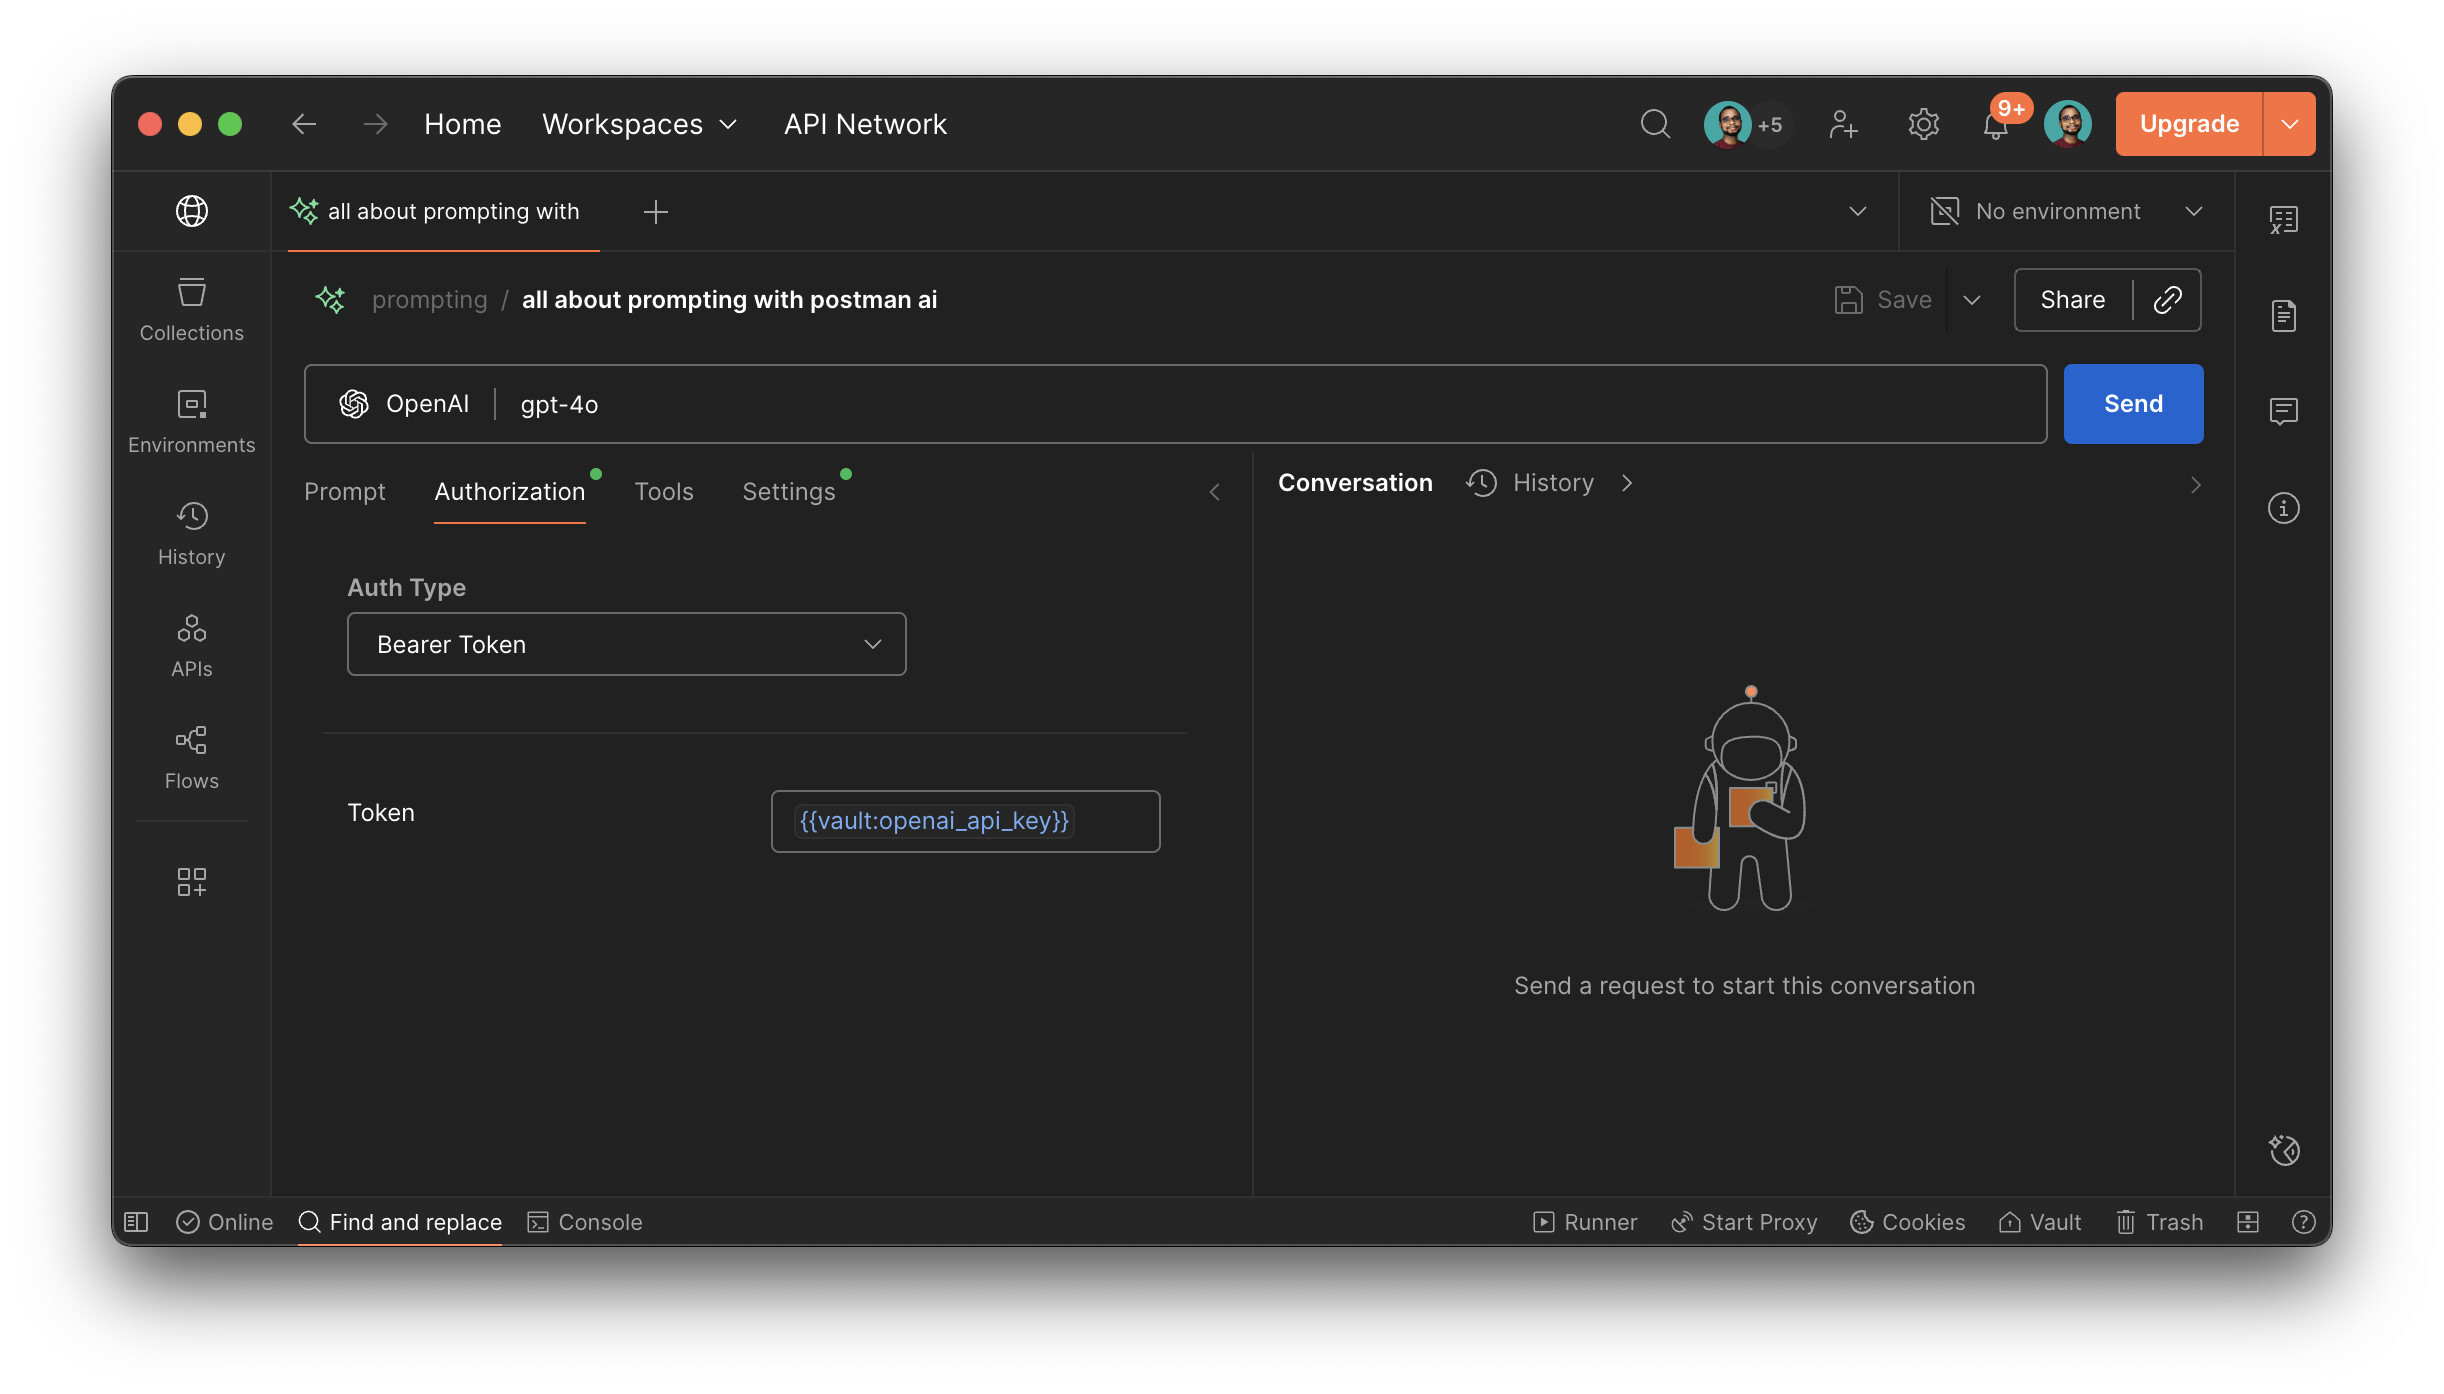
I’ve included a screenshot of my Agent Mode chat below, showing how I explored and uncovered this new trick.
Here are a few underrated time-savers in Postman that many experienced users still overlook. Each one is easy to adopt and can shave a lot of clicks off your daily flow.
Quick Switcher: jump anywhere without touching the mouse
What it is: A universal “Go to anything” palette to open requests, collections, environments, tabs, or workspaces with fuzzy search.
How to access: Press Cmd+K (macOS) or Ctrl+K (Windows/Linux), then type part of the name (e.g., “users get”, “env prod”, or “DJ workspace”).
Why it’s useful: It replaces most sidebar navigation and helps you hop between frequently used items instantly. You can also create new requests right from here by typing a URL.
Inline variable inspection and edit via hover
What it is: Hover over a variable like {{skillcheckBaseUrl}} in a request to see the resolved value, its scope (environment/global/collection), and a quick link to edit it.
How to access: In any request, hover on the variable; click the popup to jump straight to the variable’s editor.
Why it’s useful: Eliminates hunting for the right scope; lets you fix “why is my URL weird?” issues in seconds.
Cmd/Ctrl-click to open in a background tab
What it is: Open collections, folders, and requests in new tabs without losing your place.
How to access: Cmd-click (macOS) or Ctrl-click (Win/Linux) on items in the sidebar, search results, or links in descriptions.
Why it’s useful: Great for building a review queue—open a batch of endpoints, then work through them without bouncing back to the sidebar.
Duplicate Tab as Scratchpad
What it is: Clone your current request tab to experiment without disturbing the original (headers, body, auth included).
How to access: Right-click the tab name → Duplicate.
Why it’s useful: Perfect for quick diffs of bodies/headers or trying alternative auth without saving accidental changes to the source request.
Test failures jump-to-line and rerun
What it is: Clicking a failing test in the response panel jumps directly to the failing line in the Tests script.
How to access: Send a request with tests; when a test fails, click the failure in the Test Results panel.
Why it’s useful: Cuts the context-switching overhead when debugging complex test suites—fix and rerun fast.
Send and Download for large payloads
What it is: Stream a response directly to a file instead of rendering it in the UI.
How to access: Next to the Send button, open the dropdown → Send and Download.
Why it’s useful: Ideal for large JSON/CSV/pdf responses; avoids UI sluggishness and keeps a clean artifact for later analysis.
Collection-level pre-request and test scripts (inheritance)
What it is: Scripts added at the collection (or folder) level automatically run for all nested requests.
How to access: Open the collection → Tests or Pre-request Scripts tab.
Why it’s useful: Centralize auth token refresh, request signing, or standard assertions once—no more copy-paste across requests.
Quickly toggle “Retain Headers on Redirect” and “Automatically follow redirects”
What it is: Per-request redirect behavior that can silently break auth if not tuned.
How to access: In a request, open Settings (gear icon in the right sidebar) → Request Settings.
Why it’s useful: When dealing with 302s that drop Authorization headers, flipping “Retain headers on redirect” saves nasty debugging time.
Use examples to power instant mock servers
What it is: Saved examples on a request can be used to spin up a mock server with stable, realistic responses—no backend required.
How to access: In a request, click Examples → Save an example. Then from the collection, Create Mock Server and select the collection.
Why it’s useful: Frontend/backend parallelism, repeatable demos, and reproductions for bug reports without writing any server code.
Console search and filter
What it is: The Postman Console supports filtering by request name, status, or text.
How to access: View → Show Postman Console (or Cmd+Alt+C / Ctrl+Alt+C). Use the search bar at the top.
Why it’s useful: When debugging multi-request flows, quickly isolate a single call’s logs or find that one header among many.
Here are some powerful but often-overlooked Postman features that can genuinely save you time:
- Quick Open (Cmd/Ctrl + K or Cmd/Ctrl + P)
This is probably the most underutilized feature. It’s a command palette that lets you:
Search and open any request, collection, folder, or environment by name
Jump between tabs instantly
Access workspace switcher
Search for monitors, mock servers, flows, etc.
Why it’s useful: Instead of clicking through the sidebar to find a request buried in a nested folder structure, just hit Cmd/Ctrl + K and type the first few letters. It’s dramatically faster than navigation.
- Environment Quick Switch (Top-right dropdown)
Most users know environments exist, but many don’t realize you can:
Switch environments with a single click from the top-right
Use keyboard shortcuts to cycle through environments
Set environment-specific variables that override globals
Why it’s useful: If you’re testing across dev/staging/prod, this eliminates the need to manually change base URLs or API keys in requests.
- Pre-request Script Execution Order (Collection-level scripts run first)
Lesser-known fact: You can set pre-request scripts at the collection level, and they execute before every request in that collection.
Why it’s useful: Set up authentication tokens, refresh tokens, or common headers once at the collection level instead of repeating them in every request. This is a game-changer for API workflows.
- Postman Variables Scoping (Local → Collection → Environment → Global)
Variables follow a hierarchy, and understanding it can eliminate bugs:
Local variables (set in scripts, highest priority)
Collection variables
Environment variables
Global variables (lowest priority)
Why it’s useful: You can override a global base URL with an environment variable for a specific test run without touching the global. This prevents accidental changes.
- Response Body Search (Cmd/Ctrl + F in response)
When you get a large JSON response, you can search within it directly in the response pane.
Why it’s useful: Finding a specific field in a 1000-line JSON response is instant instead of scrolling.
- Duplicate Tab (Right-click on tab)
Right-click any request tab and select “Duplicate Tab” to create a copy without saving it.
Why it’s useful: Test variations of a request without cluttering your collection. The duplicate is temporary and won’t be saved unless you explicitly save it.
- Collection Runner with Data Files (CSV/JSON)
Most users know about collection runs, but fewer know you can:
Upload a CSV or JSON file with test data
Iterate through rows automatically
Use {{$randomInt}}, {{$timestamp}}, and other dynamic variables
Why it’s useful: Run the same request 100 times with different payloads without writing a single line of code.
- Postman Interceptor (Capture real traffic)
There’s a browser extension that captures HTTP requests from your browser and imports them directly into Postman.
Why it’s useful: Instead of manually recreating requests, capture them live from your web app. Saves tons of time for reverse-engineering APIs.
- Keyboard Shortcut: Cmd/Ctrl + Shift + C (Copy as cURL)
Right-click any request and copy it as a cURL command, or use the shortcut.
Why it’s useful: Share requests with teammates who use the command line, or debug in terminal without leaving Postman.
- Vault Variables (Encrypted storage)
In your workspace settings, you can create Vault variables that are encrypted and never logged.
Why it’s useful: Store API keys, passwords, and secrets securely. They won’t appear in logs, exports, or shared workspaces unless explicitly shared.
The History Tab with Advanced Filtering
What It Is:
Most users know about the History tab, but very few leverage its advanced search and filtering capabilities to quickly find and reuse past requests without saving them to collections.
How to Access:
Open the sidebar (left panel)
Click on the History tab (clock icon)
Use Ctrl/Cmd + H to quickly jump to History from anywhere
In the History search bar, you can:
Search by URL, method, or status code
Filter by date range
Group by collection or ungrouped requests
The Hidden Power:
Right-click on any history item to get options like:
“Save Request” - instantly save to a collection
“Add to Collection” - add without opening
“Delete” - clean up your history
Multi-select history items (Ctrl/Cmd + Click) to bulk save or delete
Use the search with operators like status:200 or method:POST to filter precisely
Why It’s Incredibly Useful:
Rapid Prototyping: When testing APIs, you don’t need to save every variation. Just experiment freely and pull successful requests from history later.
Debugging: Quickly compare a working request from yesterday with today’s failing one by searching history.
Time Savings: Instead of recreating requests or searching through collections, find your exact request with parameters in seconds.
Clean Workflow: Keep collections organized with only finalized requests while using history as your “scratch pad.”
Pro Tip:
Combine this with Ctrl/Cmd + K (Command Palette) and type “History” to access recent requests even faster, or search for specific endpoints across your entire history.
This feature essentially gives you a “time machine” for your API testing without cluttering your collections, saving dozens of clicks per day for active API developers!
Here’s a powerful but often-overlooked Postman productivity booster:
Hidden feature: Quick Look Variables (Shift + Cmd/Ctrl + ;), with inline variable resolution preview
What it is: A lightweight, floating inspector that shows the live value of every variable in scope (environment, collection, globals, local, data) and a companion behavior that previews resolved variable values right inside request editors. Together, they cut down context switching and prevent “why is this value undefined?” debugging loops.
How to access it (step-by-step):
Open the Quick Look panel
Windows/Linux: Shift + Ctrl + ;
macOS: Shift + Cmd + ;
Or click the tiny eye icon next to the active environment selector in the top bar.
Inspect variable scopes instantly
The panel lists Environment, Collection, Globals, and (when applicable) Iteration/Data variables.
Hover any variable to see the source scope and click to copy its value.
See inline variable resolution preview
In any request field (URL, headers, auth fields, body), hover or click a {{variable}} token.
Postman shows the current resolved value as a tooltip/subtle inline hint.
If multiple scopes define the same variable, the effective value is shown (with scope precedence applied).
Why it’s useful:
Zero context switching: No need to open the full environment editor or collection settings to check values.
Faster debugging: Immediately confirm whether a variable is set, which scope it’s coming from, and what Postman will actually send on wire.
Prevents misfires: Catch typos and casing issues ({{ApiKey}} vs {{apiKey}}) in seconds.
Safer changes: See the current value before editing. If you need to update, you can jump straight to the correct scope instead of guessing.
Extra tips and advanced tricks:
Scope precedence at a glance: If a variable name is repeated across scopes, Quick Look makes it obvious which one wins. This avoids mysterious behavior when a global masks an environment var.
Rapid variable overrides:
Temporarily set a variable for a single run via pm.variables.set(‘name’,‘value’) in a pre-request script. It shows up under “Local” in Quick Look and won’t pollute your environment or globals.
Use Data/Iteration variables (Collection Runner/Monitor) to override values at run time without touching environments; they appear in Quick Look during executions.
Inline verification in headers and auth:
For auth headers like Authorization: Bearer {{token}}, hover {{token}} to verify it’s fresh. Saves a round trip when your requests 401 due to expired tokens.
Debug missing values quickly:
If you see {{variable}} unresolved in previews, open Quick Look and search by name to see if it exists anywhere. If not, create it in the right scope on the spot.
Safe redaction patterns:
If you store secrets in the Postman Vault or as masked environment values, Quick Look respects masking while still indicating that the variable is present and which scope provides it.
Testing plus visibility:
In tests, log variable resolution with pm.test and console.log to verify final values; then keep Quick Look open to reconcile what your scripts set versus what the UI shows.
Speed-run variable audits:
Before sharing a collection/workspace, open Quick Look and scan for any hardcoded secrets in Globals or Environments that should be moved to the Vault or turned into placeholders.
When to use it:
Before sending any request that relies on authentication, dynamic URLs, or data-driven fields.
While debugging a failing test or unexpected response.
After importing a collection to ensure your environment variables match the expected names.